1 Introduction
This exercise introduces the various solvers that Matlab has, including the symbolic one and numeric solver, and using plots to find solutions to the equations.
2 Procedure
-
Find the two solutions of
The answers are 1 and 6.
-
Solve
The answer is .
-
Find centers of the two circles with radius 6 that that intersects at and .
The answer is and .
-
Solve .
The numberic solver gives .
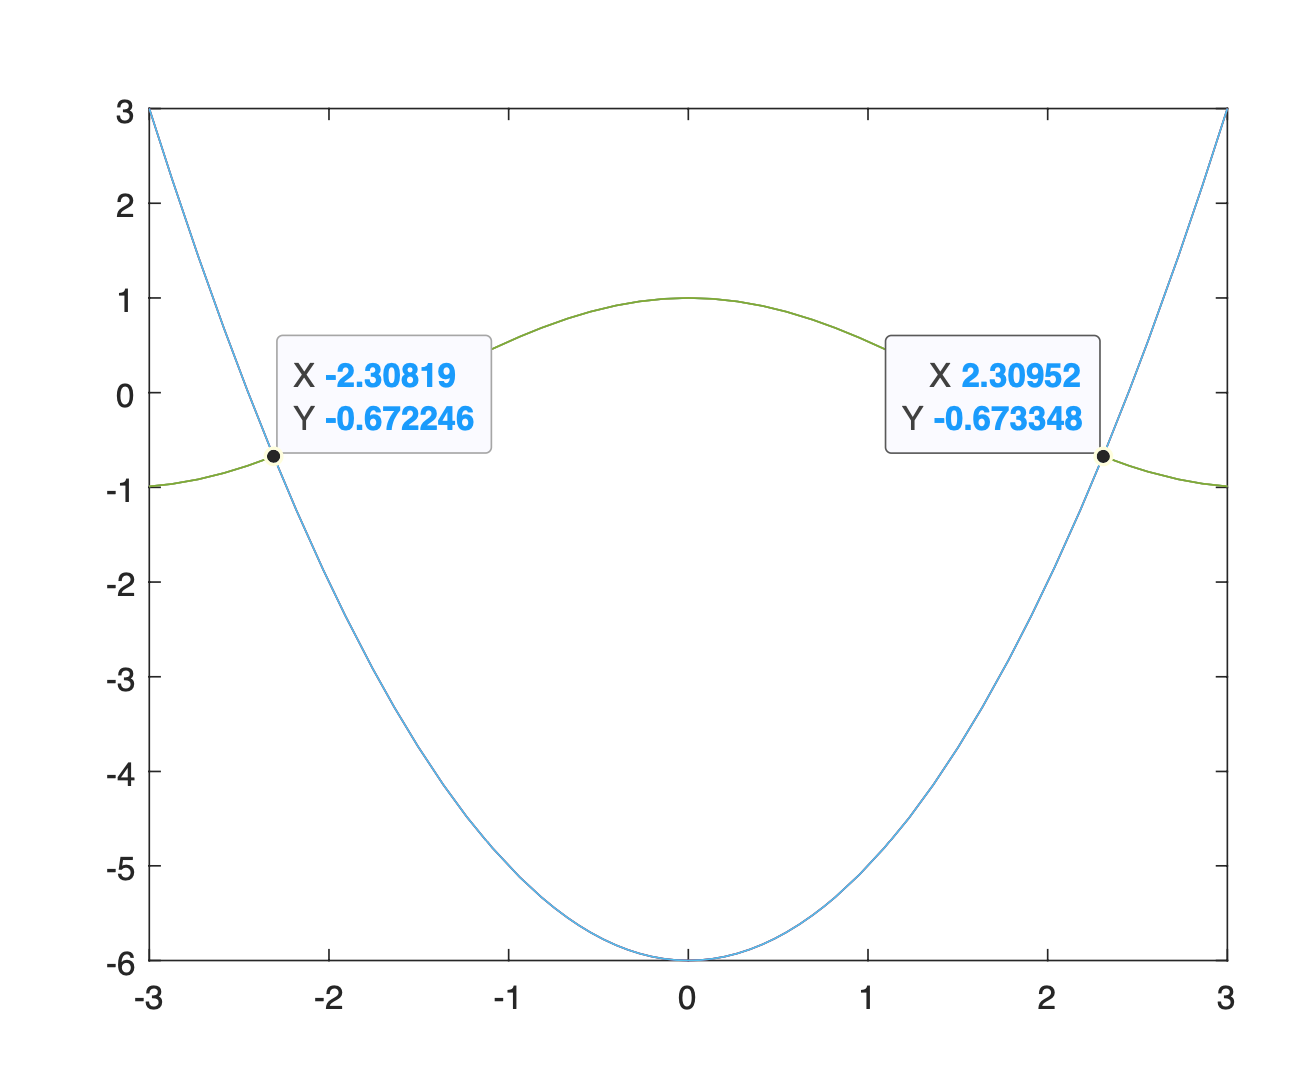 Figure 4.1 Plot of and .
 -
How many solutions does have? Find the first three positive solutions.
There are infinitely many solutions, the first three solutions that are greater than 0 are
0.78539816339744830961566084581988,3.9269908169872415480783042290994,7.0685834705770347865409476123789. -
Give a equation of form that crosses which is a function with two real roots two times.
.
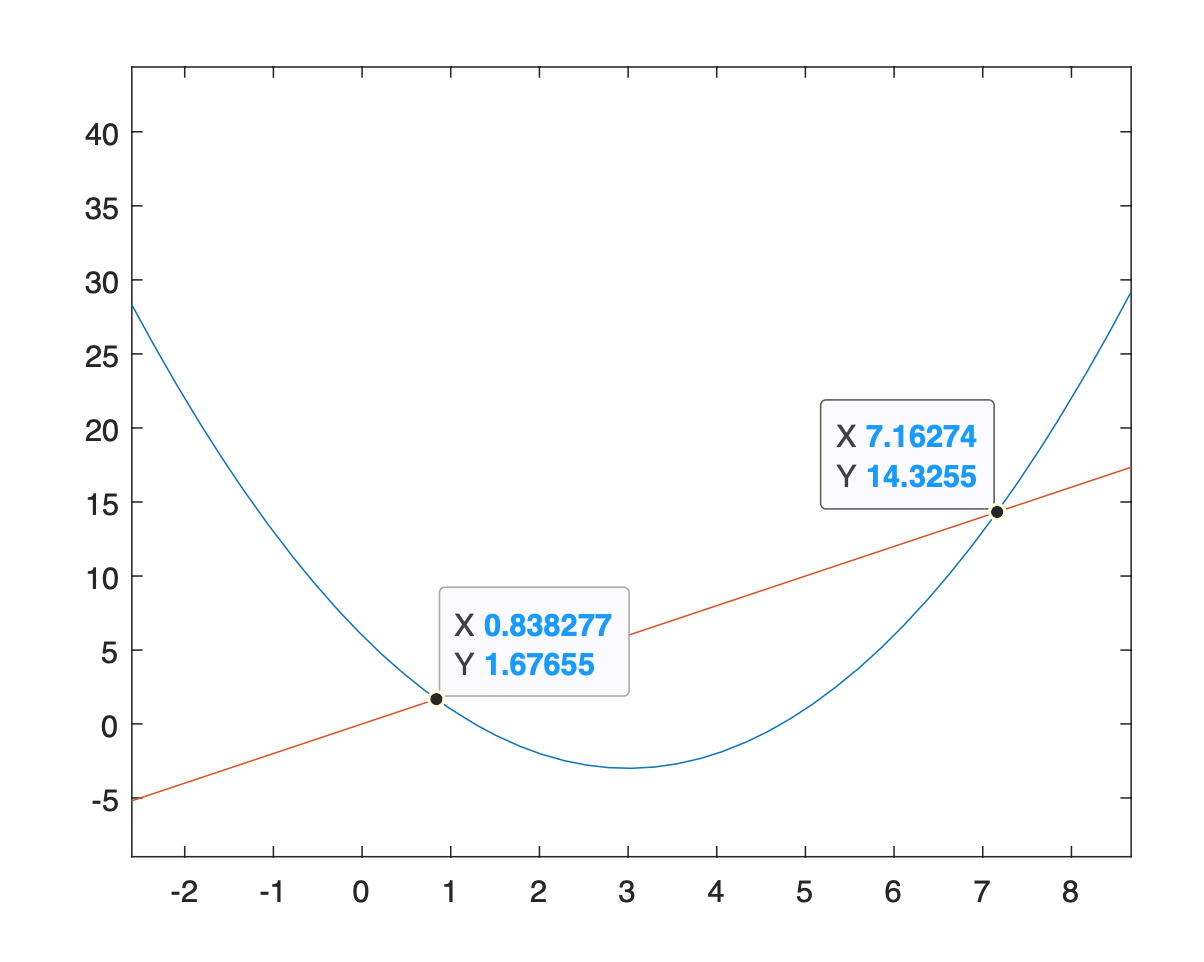 Figure 6.1 Plot of and .
3 Feedback
This exercise requires to install additional Symbolic Math Toolbox, in additions to the regular installation of Matlab.
I used sections to organize the problem solutions in the Matlab
script. fplot() is used instead of
the ezplot() for the later is not
recommended in the help documentation.